Displaying items by tag: visualization
Monday, 27 November 2017 00:00
Wikiverse
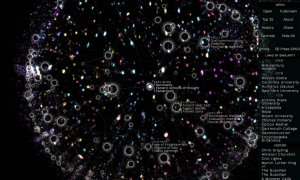
Wikiverse is a galactic reimagining of Wikipedia. Zoom around to visit clusters of stars representing interconnected topics -- clicking on one will load the article itself right within the interface. Since each star is visually connected to related entries with colored loopy lines, you can hop around like you would on the actual Wikipedia web site.
Published in
Link of the Day
Tagged under
Monday, 20 November 2017 00:00
HeyWhatsThat

How much of the earth is visible from any given location? With this tool, you can generate a radial sight map of what you can see, while standing anywhere in the world.
Published in
Link of the Day
Tagged under
Thursday, 31 August 2017 00:00
Windy
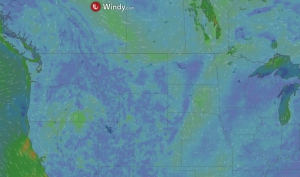
Windy is a live animated weather map showing cloud coverage, jetstreams, temperature, forecasts, and more.
Published in
Link of the Day
Tagged under
Tuesday, 23 May 2017 00:00
A Day in the Life of Americans
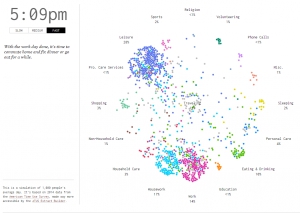
This is a visual simulation of 1,000 people's average day. It's based on 2014 data from the American Time Use Survey, made accessible by the ATUS Extract Builder.
Published in
Link of the Day
Wednesday, 01 March 2017 00:00
Piktochart
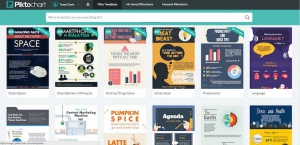
Piktochart is a tool for creating infographics, social media flyers, presentations and more. Piktochart is easy to use and full of options which allow students to enhance their creativity, and personalize and make their projects authentic, visually engaging, personal to their interests.
Published in
Link of the Day
Tagged under
Saturday, 18 February 2017 00:00
DebateGraph
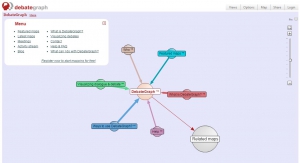
Debategraph is a wiki debate mindmapping and visualization tool that lets you: present the strongest case on any debate that matters to you; openly engage the opposing arguments; create and reshape debates, make new points, rate and filter the arguments; monitor the evolution of debates via RSS feeds; and, share and reuse the debates on and offline.
Published in
Link of the Day
Tagged under
Tuesday, 17 January 2017 00:00
Infogram
Infogram is a data visualization tool that lets you create eye-catching infographics and charts.
Published in
Link of the Day
Tagged under
